
0 comment Monday, May 12, 2014 | admin
Scientific illustration has been around for centuries, to document new findings in the natural world.Charles Darwin used illustration to record what curiousities he found on his travels, and there is a large online record of his illustrations here.
In Charles Darwin's time, photography was not advanced enough to catalogue species that he had found, so accurate illustration was important. Nowadays, photography is more likely to be used to document new species.Thus, if someone in this century decides to make a scientific illustration, the chances are that the purpose is for the benefit of art and not science.
Here are some archived illustrations from the past 250 years:

Fossils, Harvard University
 Pierre Joseph Prunus Domestica1801-19
Anatomy of the hand Clorion1830

Fossils, Harvard University

Natural History Museum, London
 Colour plate Verzeichniss meiner Insecten-Sammlung Jakob Sturm, Nürnberg1796
There are some great sources for scientific illustration online at the moment. I'm following the Scientific Illustration Tumblr and have added the BioDivLibrary on Flickr for a hit of natural history every day.
In Charles Darwin's time, photography was not advanced enough to catalogue species that he had found, so accurate illustration was important. Nowadays, photography is more likely to be used to document new species.Thus, if someone in this century decides to make a scientific illustration, the chances are that the purpose is for the benefit of art and not science.
Here are some archived illustrations from the past 250 years:
Fossils, Harvard University
Pierre Joseph Prunus Domestica1801-19 Anatomy of the hand Clorion1830
Fossils, Harvard University
Natural History Museum, London
Colour plate Verzeichniss meiner Insecten-Sammlung Jakob Sturm, Nürnberg1796There are some great sources for scientific illustration online at the moment. I'm following the Scientific Illustration Tumblr and have added the BioDivLibrary on Flickr for a hit of natural history every day.
Labels: Anatomy, Archive, Biodiversity Heritage Library, Botanical, Butterfly, Charles Darwin, Fossils, Illustration, Insect, Insects, London, Natural History Museum, Prune, Tumblr, Zoology
0 comment Tuesday, April 1, 2014 | admin
I always find it interesting to see how other artists interpret scientific data. For example, I recently wrote an entry on Omid Kashan who designed a timeline for the universe, which was then featured on the Information Is Beautiful website.
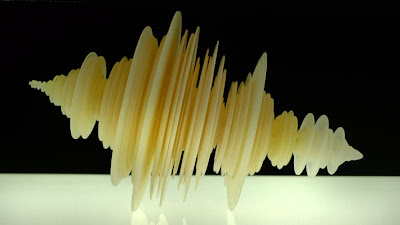
The work of Luke Jerram is similarly exciting. Jerram has analysed the seismograph from the recent earthquake in Japan and has represented the graph 3-dimensionally.The sculpture was made by designing the sculpture on a 3-D rapid prototyping machine.


Jerram has recently been involved with virologists at the University Of Bristol, which led to the design of glass microbiology sculptures.

These glass sculptures will be exhibited at GV Art in London from the 2nd of December 2011 until the 18th of February 2012. Click here to download a PDF of the event.
The work of Luke Jerram is similarly exciting. Jerram has analysed the seismograph from the recent earthquake in Japan and has represented the graph 3-dimensionally.The sculpture was made by designing the sculpture on a 3-D rapid prototyping machine.
Jerram has recently been involved with virologists at the University Of Bristol, which led to the design of glass microbiology sculptures.
These glass sculptures will be exhibited at GV Art in London from the 2nd of December 2011 until the 18th of February 2012. Click here to download a PDF of the event.
Labels: 3D Rapid Prototyping, Art, Data, Glass, Gv Art, Information Is Beautiful, London, Luke Jerram, Science, Sculpture, Seismograph, Virus, Viruses